Larry --
I've been pondering your method for deriving tilt angles from inertial -vs- barometric altitude since you shared it with me last year.
I believe you are on to something there.
But in the case of Adrian's F10 flight, could the divergence be due to transonic static port pressure sampling issues ?
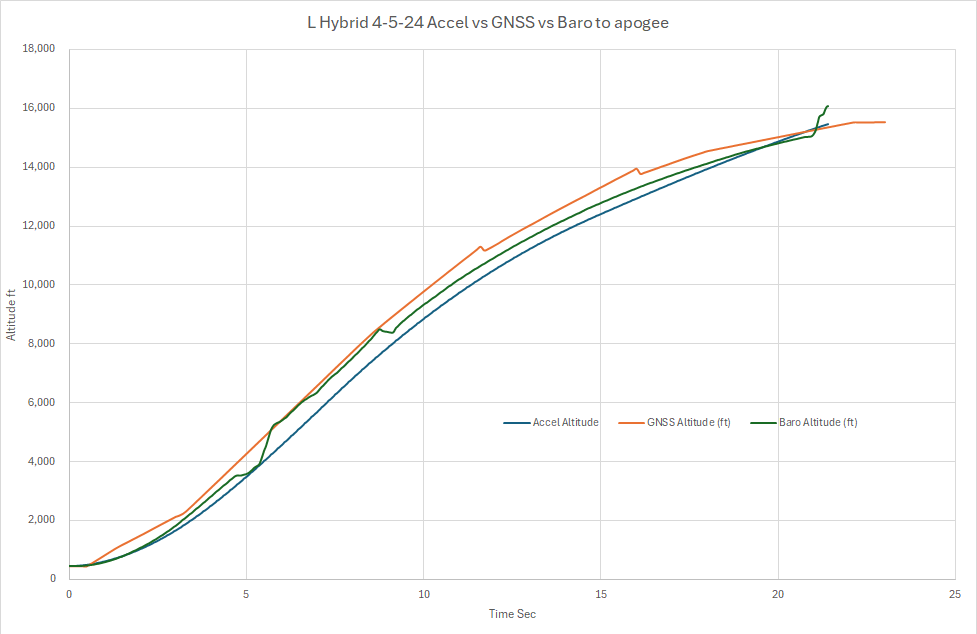
These are all the Altitudes I could muster from Adrian's Data Files along with Vertical Velocity from the low_rate file for Adrian's F10 flight:
View attachment 644359
Legend:
PAlt(u) - uncorrected Barometric Pressure Altitude
DAlt(c) - PAlt corrected for ISA Temperature Lapse Rate and Site Altitude via Richard Nakka's method.
IAlt(c) - Inertial Altitude from the Blue Raven Low Rate file
GPS - GPS Altitude from the Featherweight GPS
VVel - Vertical Velocity from the Blue Raven Low Rate file.
Note that the slopes of the PAlt and DAlt curves begin to diverge from the slopes of GPS Alt and IAlt when the rocket is moving about 800 ft/sec or so.
Also note that DAlt is really just PAlt corrected for Site Altitude, Site Temperature and Temperature Lapse Rate so they SHOULD have the same shape
")
Now look at the same plot for his G12 flight:
View attachment 644360
Note that the slopes for the G12 flight also start to diverge at around 800 ft/sec.
Also note that the shoulders on the PAlt and DAlt are shaped like 'classic' transonic static port sampling errors.
I believe in this case, we're seeing an issue with the static port position or geometry.
I do have one Q about your second plot ... how do you calculate a BaroSine value greater than 1 ?
-- kjh
p.s. I found and fixed a bug in my implementation of Nakka's DAlt calculation after my posts #32 and #39 so the DAlts will be different here.
And after pondering Adrian's post #35 about calculated IAlt in the Blue Raven Low Rate file, I've decided to 'trust Adrian' and use IAlt from the Low Rate File so the IAlts are also different
EDIT: Never mind ...